Analysis of RusVectōrēs users
In November 2018, we posed ourselves a question: who is using RusVectōrēs, and what is most interesting for our audience? It is quite clear that NLP and DS specialists download the models, so what we searched for mostly concerned theoretical linguists, the way they find the website, which visualizations they use etc. So we launched a brief user survey and circulated it to several linguistic departments in Russian universities. Here is what we can tell about our audience now (this text is mostly written by the students of NRU HSE computational linguistics master program).
Traffic data
Over 250 human visitors open RusVectōrēs daily. Significantly more people appear on weekdays compared to weekends. Most of the users are from Russia (Ukraine, going second, gives about 20 times less traffic), and there is little traffic during Moscow night hours. Among others, distributional models for the Russian language are especially of interest for Belorussians, Americans, Norwegians and the Chinese. The most popular models by the number of downloads are those trained on the Taiga, Russian National Corpus and Araneum corpora. Curiously, 20% of the RusVectōrēs audience are Linux users.
Survey results
The bulk of the survey participants (about 2/3) are students, and there are several lecturers. Most of them conduct research both for academia and industry, only a small part uses the service for solely industrial purposes. One third of the respondents are simply curious about word embeddings and haven’t yet needed them for any research.
The areas of knowledge of the interviewed are quite similar, including Natural Language Processing, Data Science and Computational Linguistics. Around 17% and 14% of the respondents do theoretical linguistics and humanities respectively.
The main sources of knowledge about RusVectōrēs proved to be college or university lecturers, but almost as often people find the website through googling or talking to peers.

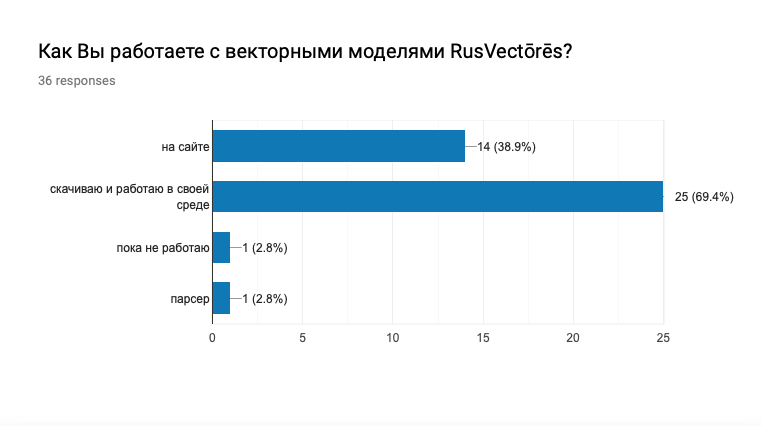
How do people work with vector models from RusVectōrēs? In truth, around 2/3 of the respondents download models and work with them locally, the rest of them feel quite satisfied with the data they can retrieve with the web GUI.

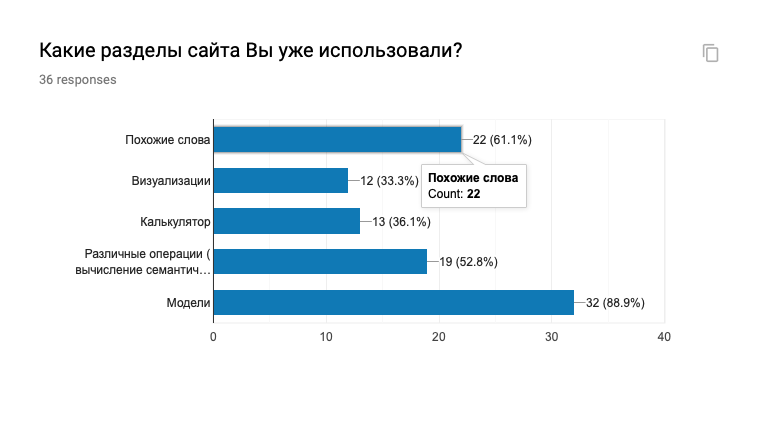
Correspondingly, the most popular section of the website is Models, along with, in rank order, Similar words, Miscellaneous, Calculator and (the last in popularity) Visualizations. Models are ahead of all the other RusVectōrēs sections in terms of usefulness.
On the whole, RusVectōrēs proved to be a convenient and informative website — that is what 80% of survey participants claim, while about 70% do not use the currently available visualizations at all.
That being said, all the respondents suggested improvements to the visualizations on the website. Over half of the respondents would like to measure distances between a word and the different clusters is tends to belong to, and also to use dynamic part-of-speech and frequency filters. Interactive graphs of words with close meanings were also popular, but slightly less than the ability to see how close the word is to the centre of its cluster. Many would also like to somehow compare semantic markup in the Russian National Corpus with the information given by word embedding models. Interactive maps of the whole models did not really intrigue the participants. We plan to start implementing the new visualization features according to the demand shown in the survey.
We have many plans for improving RusVectōrēs. Subscribe to our RSS feed and stay tuned!

